Gallery
A visual tour of lifegraph features, from the basics to advanced layouts.
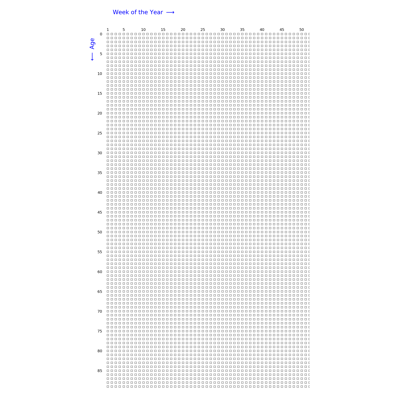
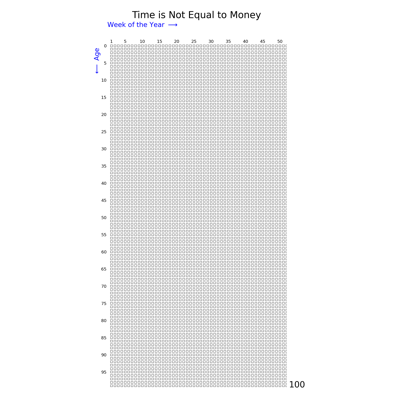
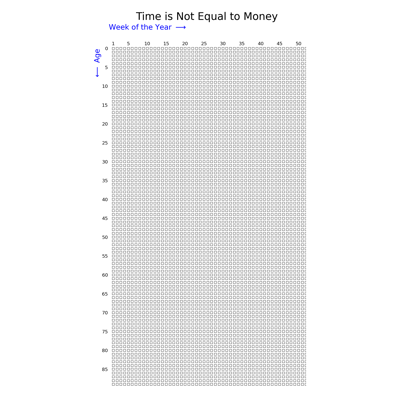
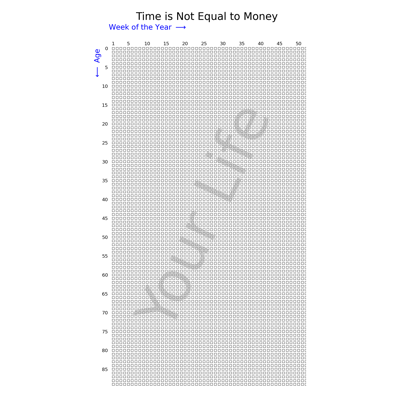
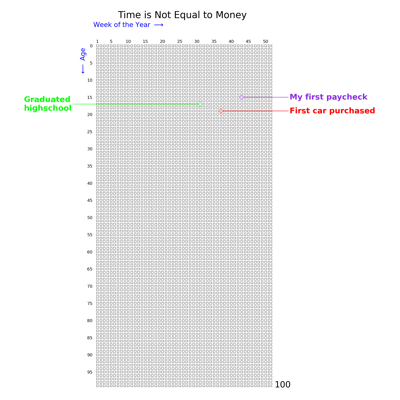
Getting Started
Create a basic life-graph grid and customise it with titles, watermarks, and age ranges.
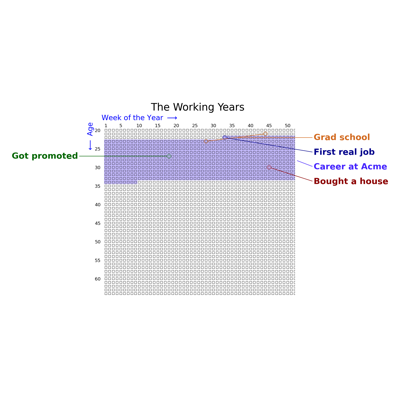
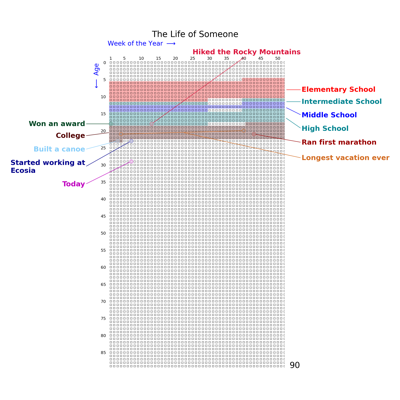
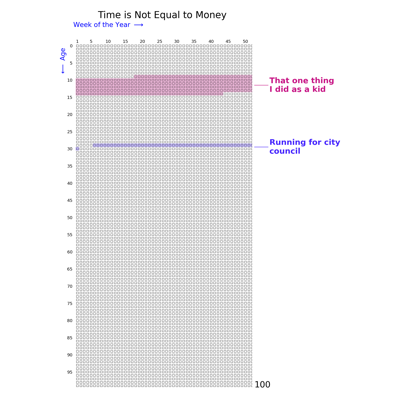
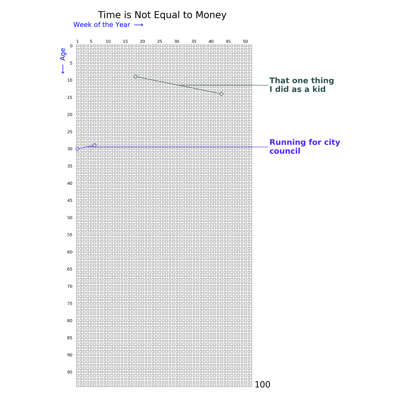
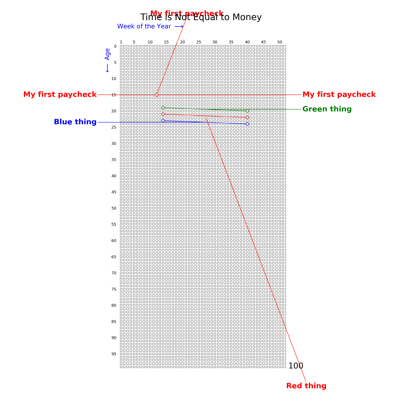
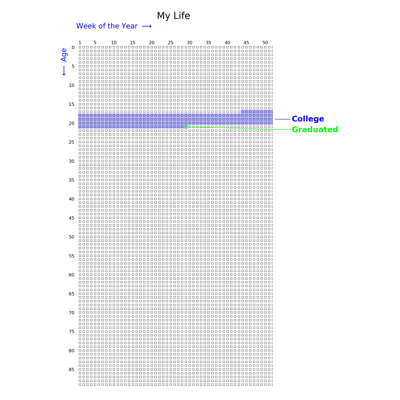
Events & Eras
Annotate your life graph with point events, shaded eras, and era spans.
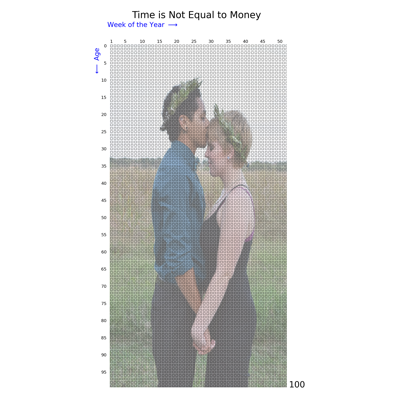
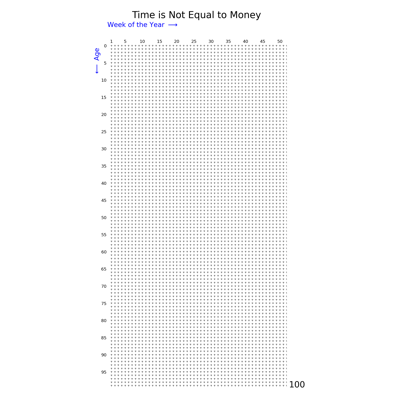
Customization
Tweak marker styles, label placement, and overlay images on the grid.
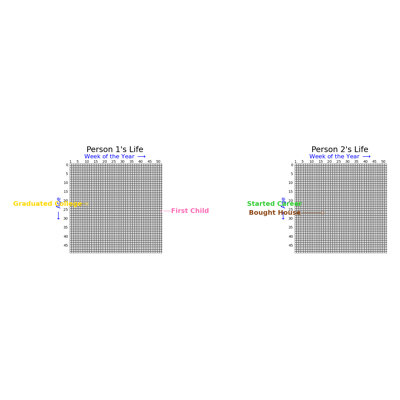
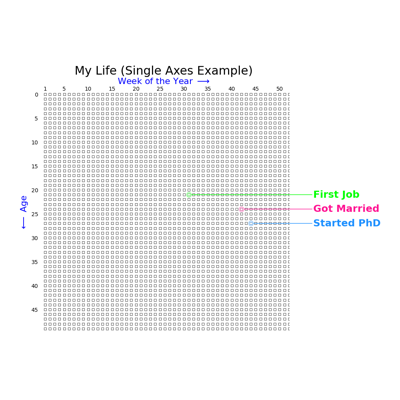
Advanced
Provide your own matplotlib axes, compose multiple graphs on one figure, and save/load configurations.
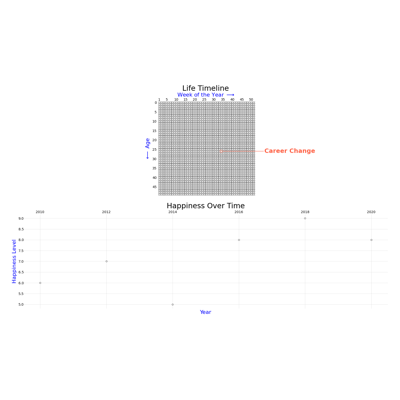
Complete Example
Putting several features together into one graph.