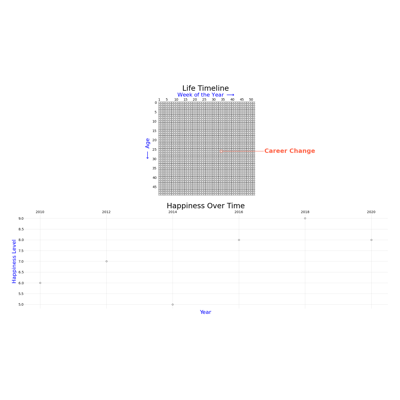
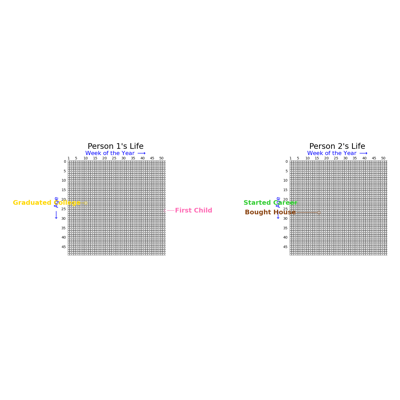
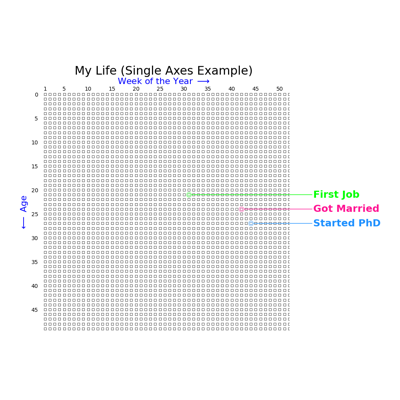
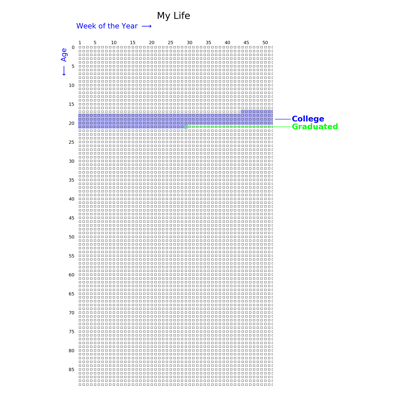
Contents Menu Expand Light mode Dark mode Auto light/dark, in light mode Auto light/dark, in dark mode Skip to content
lifegraph
lifegraph

Contents

  • Gallery
    • Getting Started
      • Basic Grid
      • Changing the Maximum Age
      • Showing a Sub-range with min_age
      • Adding a Title
      • Adding a Watermark
    • Events & Eras
      • Eras
      • Era Spans
      • Life Events
    • Customization
      • Image Overlay
      • Grid Style
      • Label Placement
    • Advanced
      • Provided Axes – Mixing with Other Plots
      • Provided Axes – Multiple Subplots
      • Provided Axes – Single
      • Saving and Loading Configurations
    • Complete Example
      • A Complete Life Graph
  • API Reference
  • Changelog
Back to top
View this page
Edit this page

Advanced

Provide your own matplotlib axes, compose multiple graphs on one figure, and save/load configurations.

Provided Axes – Mixing with Other Plots

Provided Axes -- Mixing with Other Plots

Provided Axes – Multiple Subplots

Provided Axes -- Multiple Subplots

Provided Axes – Single

Provided Axes -- Single

Saving and Loading Configurations

Saving and Loading Configurations
Next
Provided Axes – Mixing with Other Plots
Previous
Label Placement
Copyright © 2024, Kyle Shores
Made with Sphinx and @pradyunsg's Furo