Note
Go to the end to download the full example code.
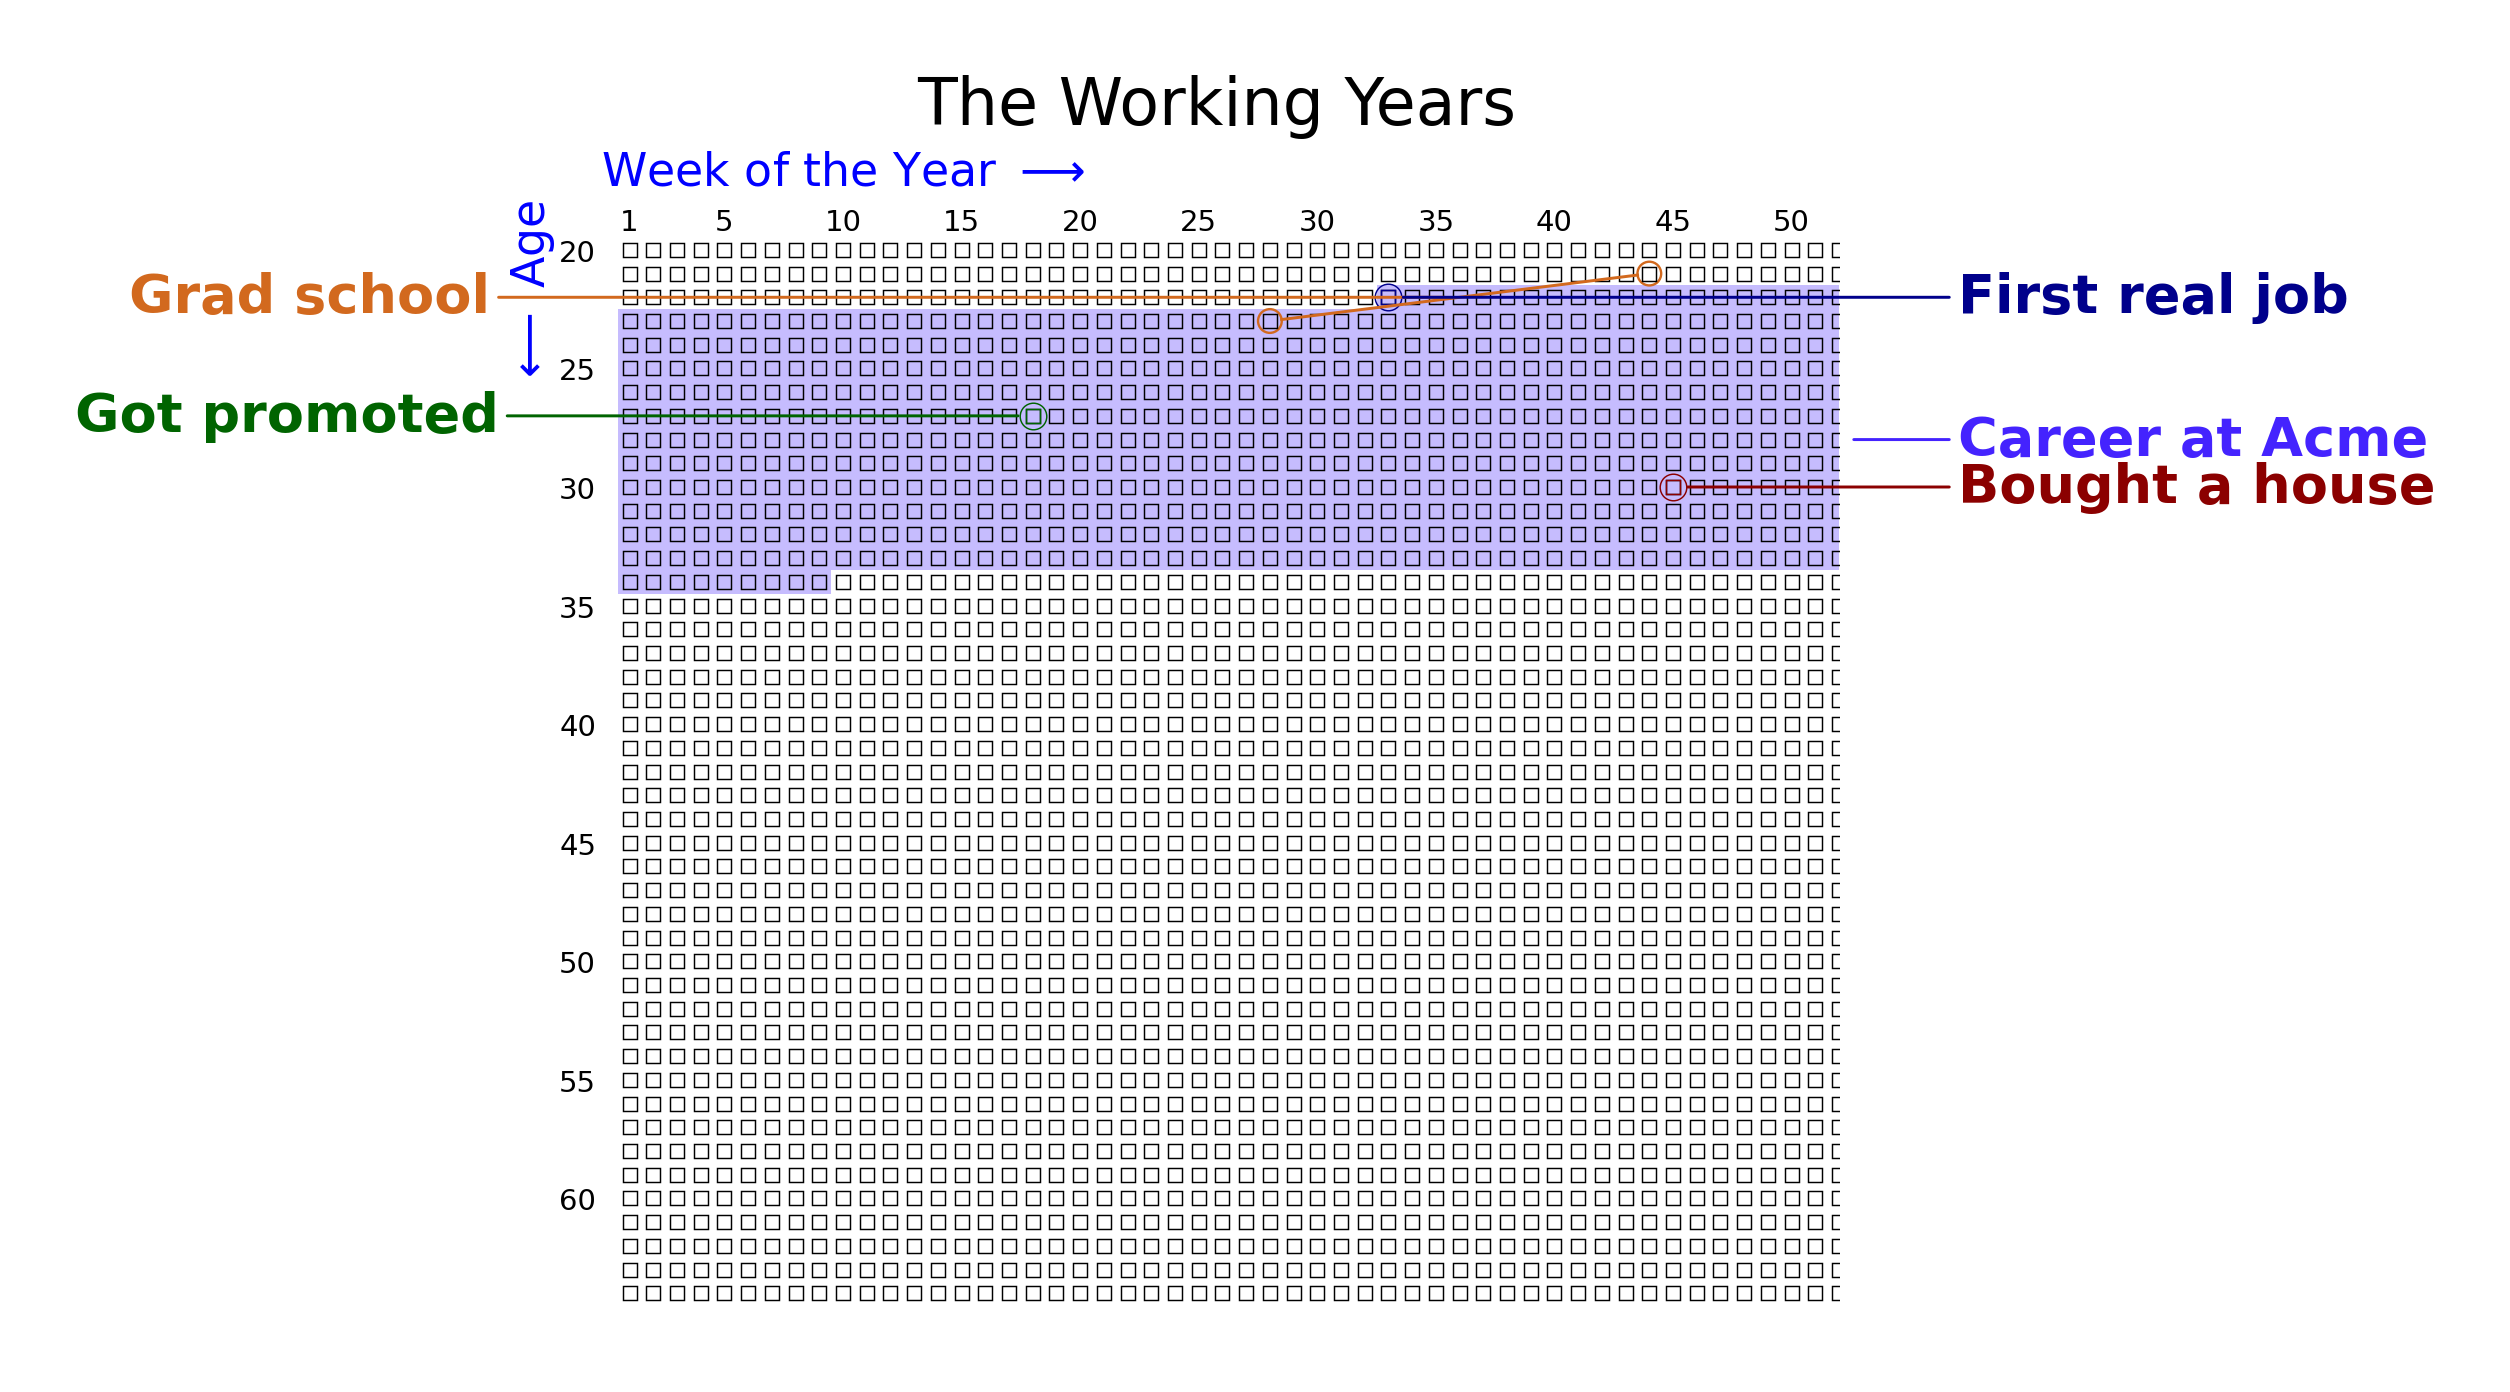
Showing a Sub-range with min_age
Display only a portion of the grid – useful for focusing on a specific period of life. Events outside the visible range are stored but not drawn, and eras that cross the boundary are clipped automatically.
from datetime import date

from lifegraph import Lifegraph, Side
from lifegraph.configuration import Papersize

birthday = date(1990, 11, 1)
g = Lifegraph(birthday, dpi=300, size=Papersize.A4, max_age=65, min_age=20)

g.add_title("The Working Years")

g.add_life_event("First real job", date(2013, 6, 15), color="#00008B")
g.add_life_event("Got promoted", date(2018, 3, 1), color="#006400", side=Side.LEFT)
g.add_life_event("Bought a house", date(2021, 9, 10), color="#8B0000")

g.add_era("Career at Acme", date(2013, 6, 15), date(2025, 1, 1), color="#4423fe")
g.add_era_span("Grad school", date(2012, 9, 1), date(2014, 5, 15), color="#D2691E", side=Side.LEFT)

g.save("grid_min_age.png")
Total running time of the script: (0 minutes 0.566 seconds)