Note
Go to the end to download the full example code.
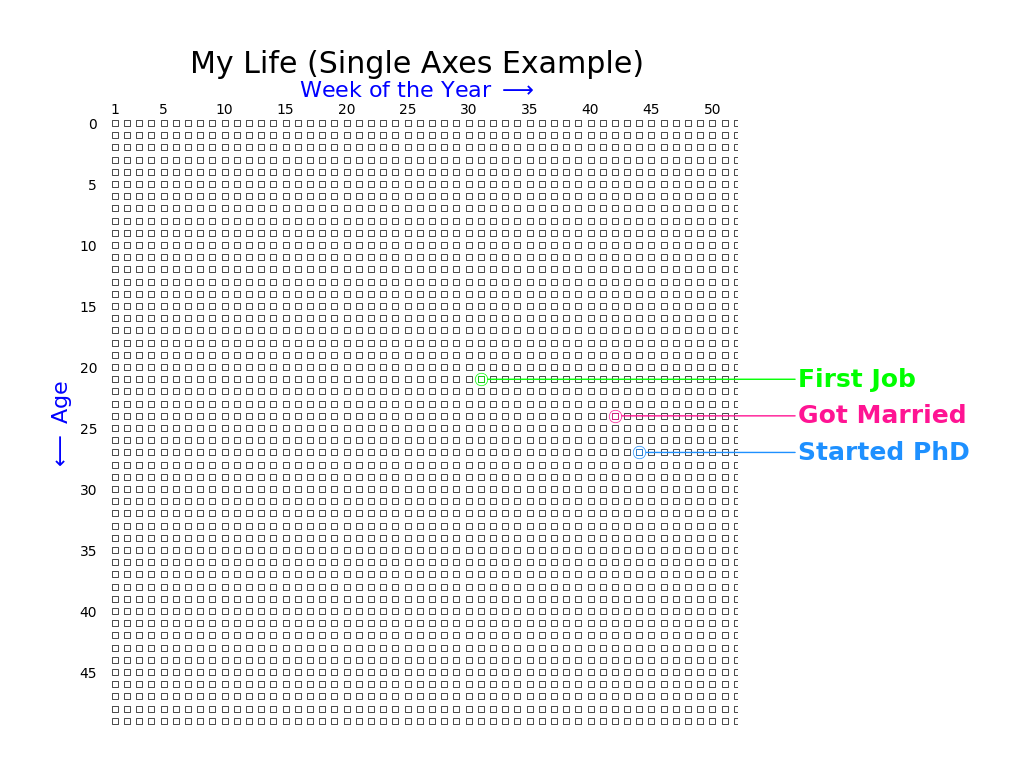
Provided Axes – Single
Pass your own matplotlib axes to control the figure layout.
Use g.draw() instead of g.save() and manage the figure yourself.
import matplotlib.pyplot as plt

from datetime import date

from lifegraph import Lifegraph

fig, ax = plt.subplots(figsize=(10, 8))

birthday = date(1990, 11, 1)
g = Lifegraph(birthday, max_age=50, ax=ax)

g.add_life_event("First Job", date(2012, 6, 1), color="#00FF00")
g.add_life_event("Got Married", date(2015, 8, 15), color="#FF1493")
g.add_life_event("Started PhD", date(2018, 9, 1), color="#1E90FF")

g.add_title("My Life (Single Axes Example)")
g.draw()

fig.savefig("provided_axes_single.png", dpi=300, bbox_inches="tight")
Total running time of the script: (0 minutes 0.556 seconds)